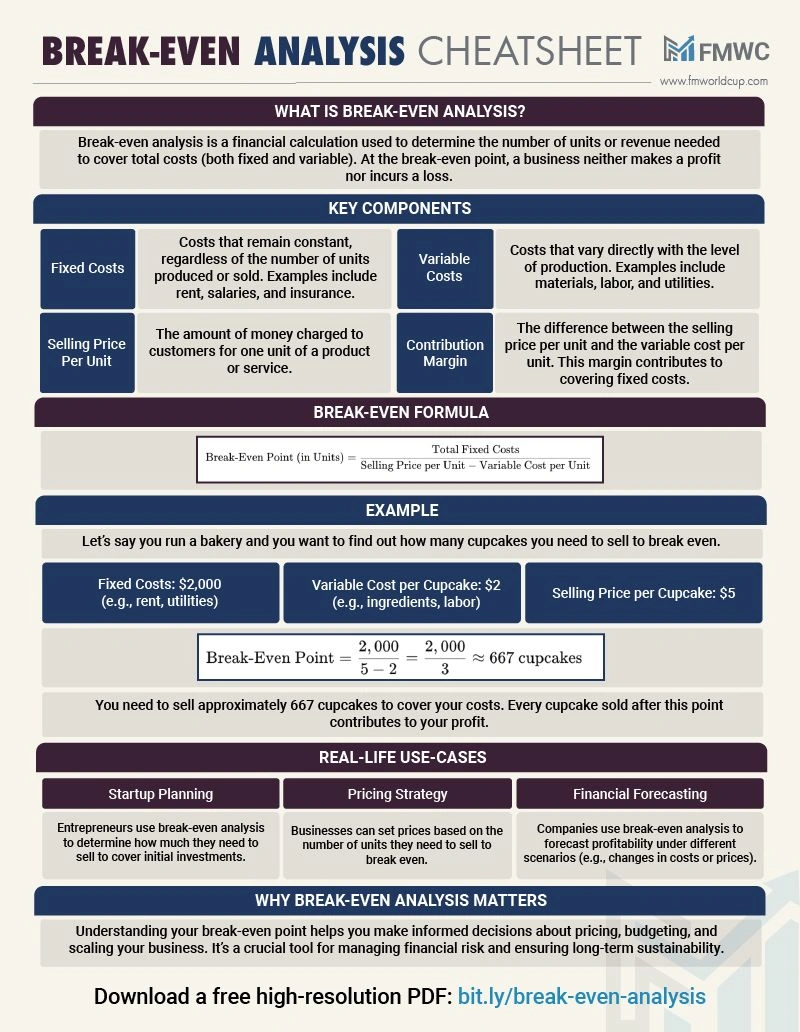
break-even analysis
A break-even analysis is a financial tool used to determine the point at which a business or project will generate enough revenue to cover its total costs, resulting in neither a profit nor a loss. It helps determine the minimum level of sales or units needed to cover expenses. Here's a step-by-step guide on how to conduct a break-even analysis:
Identify Fixed Costs
Identify all the fixed costs associated with your business or project. Fixed costs are expenses that do not change with the level of production or sales. Examples include rent, salaries, insurance, utilities, and equipment costs.
Determine Variable Costs
Determine the variable costs associated with your business. Variable costs are expenses that fluctuate based on the level of production or sales. Examples include raw materials, direct labor costs, and sales commissions.
Calculate Contribution Margin
Calculate the contribution margin per unit or per sale. The contribution margin is the difference between the selling price per unit and the variable cost per unit. It represents the amount of each sale that contributes towards covering the fixed costs and generating profit.
Contribution Margin = Selling Price per Unit - Variable Cost per Unit
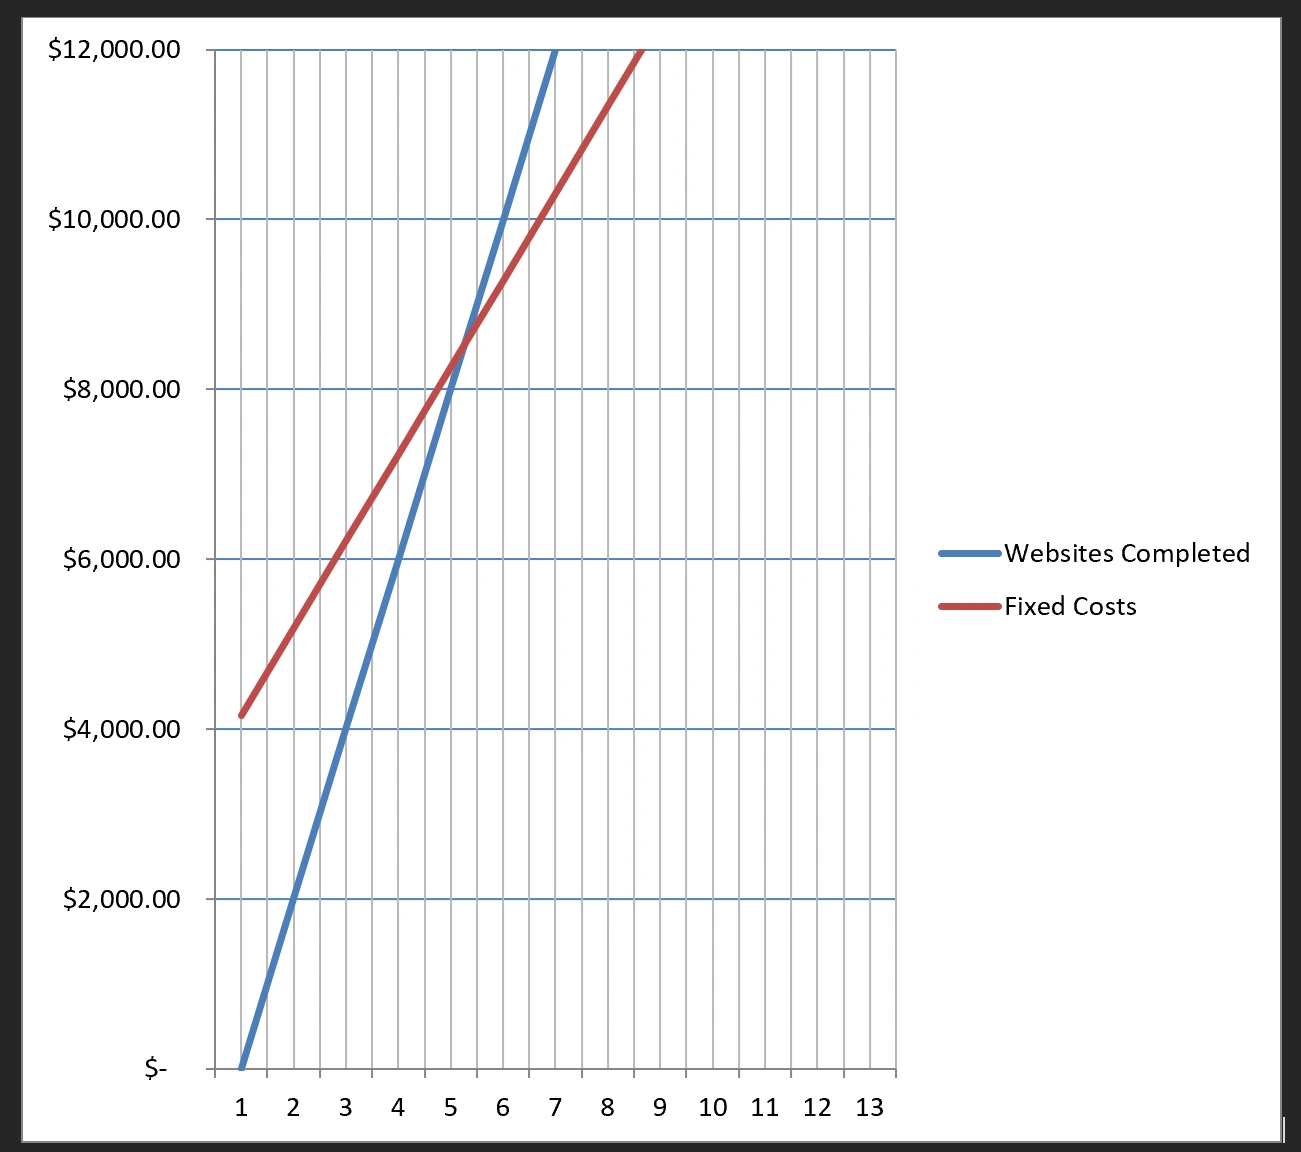
Determine the Break-Even Point in Units
Divide the total fixed costs by the contribution margin per unit to calculate the number of units you need to sell to break even.
Break-Even Point (in units) = Total Fixed Costs / Contribution Margin per Unit
Determine the Break-Even Point in Sales Revenue
Multiply the break-even point in units by the selling price per unit to calculate the break-even point in sales revenue.
Break-Even Point (in sales revenue) = Break-Even Point (in units) x Selling Price per Unit
Business Financial Viability Evaluation
-
Create Financial Statements: Start by creating three key financial statements: the balance sheet, income statement, and cash flow statement. These statements provide a comprehensive view of your business's financial position, performance, and cash flow.
-
Analyze Liquidity: Assess your business's liquidity by calculating the current ratio and quick ratio. The current ratio is calculated as: $$ Ratio = {Current Assets}{Current Liabilities} $$ A ratio of 2:1 or higher is generally considered economically viable. The quick ratio, which excludes inventory from current assets, is calculated as: $$ Ratio = {Current Assets - Inventory}{Current Liabilities} $$ A quick ratio of 1.0 or higher is considered economically viable.
-
Evaluate Solvency: Assess solvency by calculating the debt-to-equity ratio: $$ -to-Equity Ratio = {Total Liabilities}{Shareholder Equity} $$ A lower debt-to-equity ratio indicates better solvency, meaning the business relies less on debt to finance its operations.
-
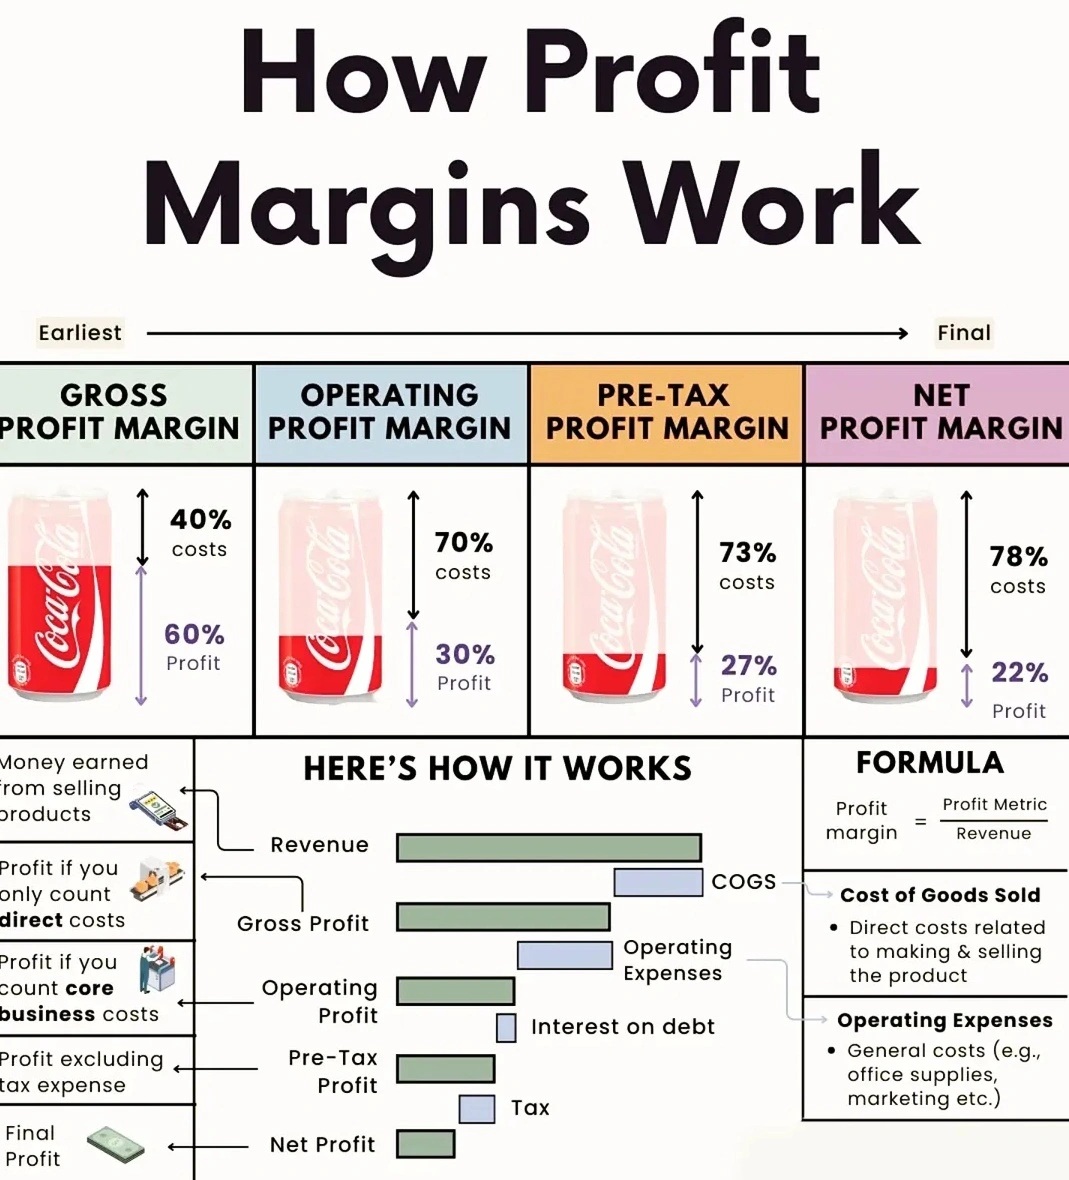
Assess Profitability: Analyze profitability using ratios such as the gross profit margin, net profit margin, and return on assets (ROA):
- Gross Profit Margin: $$ Profit Margin = {Gross Profit}{Revenue} $$
- Net Profit Margin: $$ Profit Margin = {Net Income}{Revenue} $$
- Return on Assets (ROA): $$ = {Net Income}{Total Assets} $$
profit-terms.webp)
Analyze Profitability
Compare the break-even point to your projected sales volume. If your projected sales volume exceeds the break-even point, you can expect to generate a profit. If it falls below the break-even point, you will likely incur a loss.
Sensitivity Analysis
Conduct sensitivity analysis by considering different scenarios and variables that could impact the break-even point, such as changes in costs or pricing. This will help you assess the risks and potential profitability of your business.
A break-even analysis provides valuable insights into the financial feasibility of a business or project. It helps you understand the relationship between costs, pricing, and sales volume, and enables you to make informed decisions regarding pricing strategies, cost management, and sales targets.
Pareto for Profit
The Pareto Principle (80/20 rule). Applied to subscription pricing, this often means a small percentage of clients generate the majority of your revenue, while the majority contribute little.
How to Analyze
- List all clients and their annual subscription payments.
- Rank clients from highest to lowest revenue contribution.
- Calculate cumulative revenue percentage.
- Identify the top 20% of clients and their revenue share.
Example Table
| Client | Annual Revenue | Cumulative % |
|---|---|---|
| A | $5,000 | 40% |
| B | $3,000 | 64% |
| C | $2,000 | 80% |
| D | $500 | 84% |
| E | $400 | 87% |
| ... | ... | ... |
In this example, the top 3 clients (20%) provide 80% of the revenue.
What It Means
- If most clients pay little and only a few drive your income, your pricing model may be undervaluing your services for the majority.
- Low-value clients can drain resources and support time, reducing profitability.
Action Steps
- Re-evaluate your subscription tiers: Consider raising prices or restructuring plans to better reflect the value delivered.
- Focus on high-value clients: Offer premium services or exclusive features to top-tier clients.
- Let go of unprofitable clients: Streamline your client base to focus on those who contribute most to your business.
Conclusion:
If the bulk of your clients only provide a small fraction of your revenue, it's time to adjust your subscription pricing model to maximize profitability and sustainability.