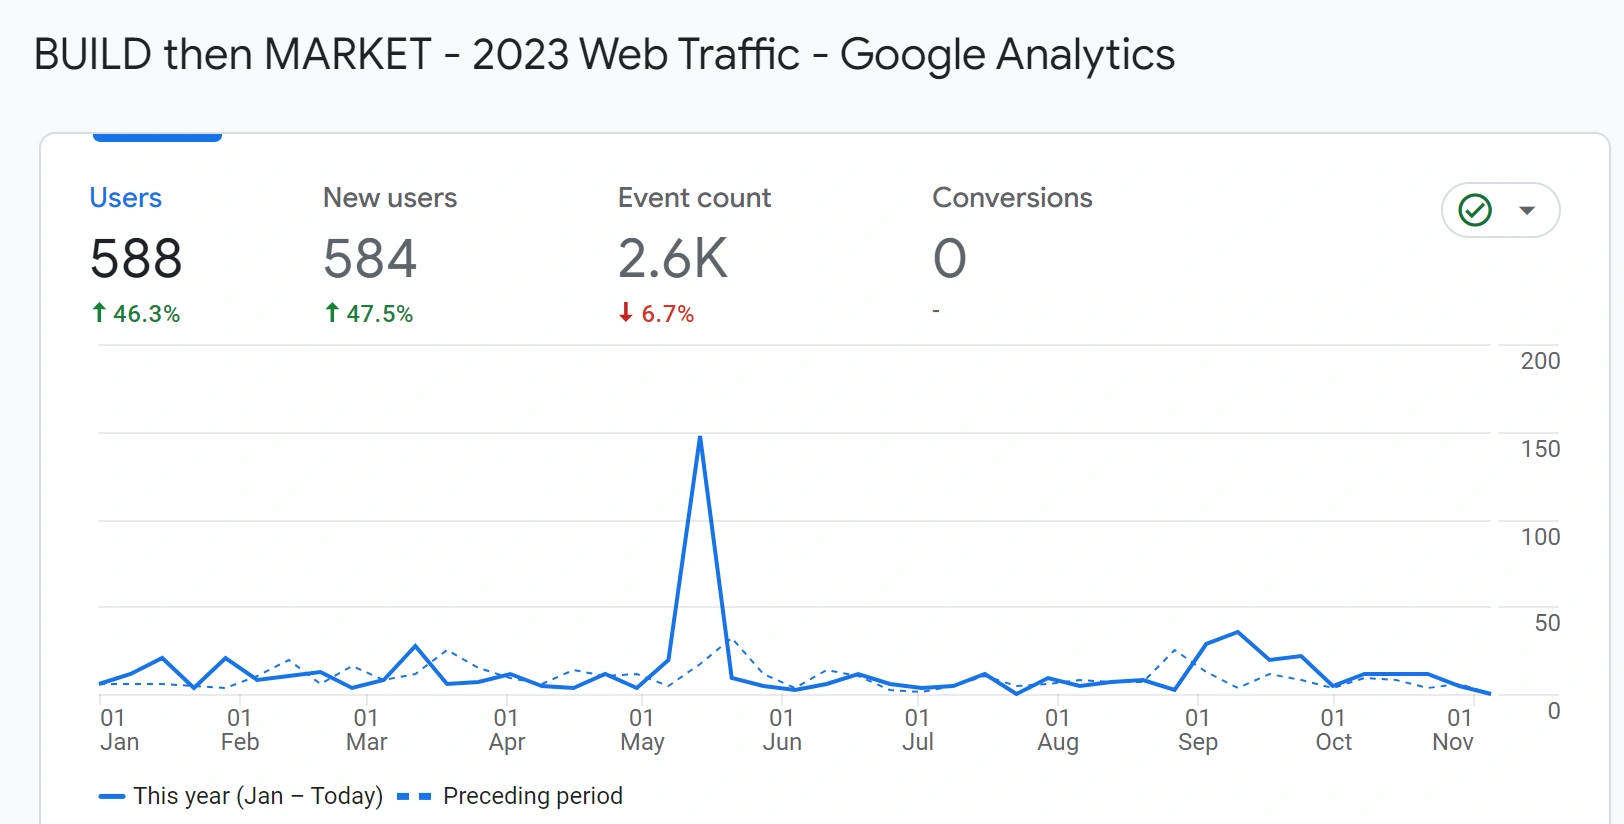
Google Analytics

📈 Part 1: Key Performance Indicators (KPIs) for Lead GenerationTo iterate on your business performance, you must move beyond basic traffic and focus on conversion efficiency and financial metrics
A. Core Lead Metrics (Conversion Efficiency)These measure how well your website converts visitors into leads
| KPI | Formula | Why it matters |
|---|---|---|
| Lead Conversion Rate (LCR) | (Total Leads / Total Visitors) \times 100 | The single most important metric for website performance. It shows the efficiency of your marketing and UX. |
| CTA Click-Through Rate (CTR) | (CTA Clicks / CTA Views) \times 100 | Measures the effectiveness of the CTA's copy, design, and placement in grabbing attention. |
| Landing Page Conversion Rate | (Form Submissions / Landing Page Visitors) \times 100 | Measures how effective your dedicated landing pages are at converting traffic sent from CTAs or ads. |
| Lead-to-MQL Rate | (MQLs / Total Leads) \times 100 | Measures the quality of the leads generated. A high rate means your targeting/messaging is spot-on. |
MQL (Marketing Qualified Lead): A lead judged ready to be nurtured further by marketing. SQL (Sales Qualified Lead): A lead vetted by sales and ready for direct outreach.
B. Financial Performance MetricsThese connect your leads directly to the bottom line
-
Cost Per Lead (CPL): (Total Campaign Spend / Total Leads Generated).
-
Goal: Decrease CPL while maintaining high lead quality.
-
Customer Acquisition Cost (CAC): (Total Sales + Marketing Spend / New Customers Acquired).
-
Goal: CAC should be significantly lower than the Customer Lifetime Value (CLV).
-
Customer Lifetime Value (CLV): The total revenue a customer is expected to bring in over the relationship.
-
Goal: Use this to justify your CPL/CAC targets.
📝 Part 2: Testing with BDD for UX and Marketing AlignmentBDD (Behavior-Driven Development) is excellent for ensuring that your marketing-driven changes (copy, images, offers) don't just look good, but actually result in the desired, testable user behavior. This creates "living documentation" that everyone understands
Use the Given-When-Then (Gherkin) syntax to write acceptance tests for your most critical CTAs.
BDD Scenarios for CTA Testing
| Area | Feature File Example (Gherkin) | Testable Behavior |
|---|---|---|
| CTA Visibility (UX) | Scenario: Primary CTA is visible on scroll. Given I am a first-time visitor on the pricing page. When I scroll past the first two pricing tiers. Then The 'Start Free Trial' sticky CTA should appear at the bottom of the screen. | Ensures the CTA is never out of sight during critical decision-making. |
| Messaging Match (Marketing) | Scenario: Offer is consistent across the funnel. Given I click the 'Claim Your Free Ebook' CTA. When I land on the signup page. Then I should see a heading that says 'Download: The Essential Guide to Tech KPIs'. | Verifies that the landing page directly delivers on the promise made in the CTA, preventing friction and bounces. |
| Lead Form Friction (UX/Conversion) | Scenario: Short lead form is available. Given I view the resource download modal. When I click 'Download Now'. Then I should only be required to enter 'Email Address' and 'First Name'. | Validates that you are maximizing conversion by minimizing required form fields. |
🎨 Part 3: A/B Testing Ideas for Copy, Images, Layouts, and AnimationsThe most effective way to boost lead generation is through A/B testing. Focus your tests on high-impact areas that directly precede the conversion event
A. Copy & Messaging (The Why and the What to Click)
| Test Idea | Variation A | Variation B |
|---|---|---|
| Focus | Feature-focused: "Start Your Free 30-Day Trial." | Benefit-focused: "See a 40% Increase in Leads Today." |
| Urgency/Specificity | "Get Started Now." | Time-limited: "Claim Your Custom Demo (Offer Expires Tomorrow)." |
| Form/Button Copy | Generic: "Submit" or "Download." | Value-driven: "Get My Custom Report" or "Start My Free Assessment." |
| Negative Language | "Don't Miss Out!" (FOMO) | Positive Reinforcement: "Join 10,000+ Satisfied Users." |
B. Design & Layout (The How to Make it Pop)
| Test Idea | Variation A | Variation B |
|---|---|---|
| CTA Color | Blends with brand colors (low contrast). | Contrasting Color (e.g., Bright Orange on a Blue background) that makes the CTA "pop." |
| CTA Placement | Only at the bottom of the page (below the fold). | Sticky/Fixed CTA that follows the user as they scroll. |
| Lead Form Style | Single-step form (all 5 fields visible). | Two-step form (only 1-2 low-friction fields visible first, then the rest). |
| Image/Hero Section | Generic stock image of people working. | Product-in-action image or Explainer Video showing the outcome/benefit. |
| Animation/Motion | Static CTA button. | Subtle Hover Effect (e.g., color shift, pulse) to draw the eye without being distracting. |
C. Trust & Context (The Confidence to Click)
| Test Idea | Variation A | Variation B |
|---|---|---|
| Social Proof | Testimonials at the bottom of the page. | Social Proof/Review Stars placed immediately above or near the CTA. |
| Trust Badges | No security badges near the form. | Security/Privacy Badges (e.g., "SSL Secure," "No Spam") placed directly under the form's submit button. |
To get started, I recommend picking one critical CTA and focusing your efforts on increasing its Click-Through Rate (CTR) using the A/B testing ideas above, and then measuring the change in your overall Lead Conversion Rate (LCR).
Would you like me to create a detailed Gherkin scenario for an A/B test on a specific element, like the CTA button color? Cheat Sheet: Universal Analytics
- Google Tag Manager (GTM): Container for managing tags (scripts like analytics, ads) without code changes. Deploys/triggers tags via UI.
- Google Search Console (GSC): Monitors site performance in Google Search (indexing, keywords, errors, crawl issues). SEO-focused.
- Google Analytics (GA): Tracks user behavior on site/app (traffic, conversions, sessions). Audience/engagement insights.
Table of Contents
- Install
- UTM Parameters
- [Event Tracking]
- track goals, conversion rates, and engagement to reach business objectives
- visitor flow: the path website visitors have taken
- loading times, speed performance which is a ranking factor
Event Tracking
- use onclick events instead of anchor links to get better usability
Event tracking in web analytics refers to the process of monitoring and measuring specific user interactions or events on a website. It provides insights into how visitors engage with a website beyond simple page views. By tracking events, website owners can gather data on user behavior, interactions, and conversions, enabling them to make informed decisions and optimize their website's performance.
Events can be defined as any user action or activity that you want to track and measure. Examples of events include button clicks, form submissions, video plays, file downloads, social media shares, ad clicks, and more. Each event is typically associated with a specific action or element on a web page.
Event tracking involves implementing tracking codes or tags on the website that capture and send data to a web analytics tool, such as Google Analytics. These codes are typically written in JavaScript and are triggered when a specific event occurs. When the event is triggered, information such as the event category, action, label, and value (if applicable) is sent to the analytics tool for analysis.
The benefits of event tracking in web analytics include:
-
Deeper Insights: Event tracking provides more granular and detailed data on user interactions, allowing you to understand how visitors engage with specific elements or features on your website.
-
Conversion Tracking: By tracking events such as form submissions or button clicks, you can measure and analyze conversion rates, identify bottlenecks, and optimize your website for better conversions.
-
User Behavior Analysis: Event tracking helps you understand user behavior patterns, preferences, and interests. It can reveal which features or content are most engaging and provide insights for improving user experience.
-
Campaign Tracking: Events can be used to track the effectiveness of marketing campaigns or promotional activities. You can track events like ad clicks or social media shares to measure the impact of your marketing efforts.
-
Goal Tracking: Events can be associated with specific goals or objectives on your website, such as signing up for a newsletter, completing a purchase, or watching a video. By tracking these events, you can monitor goal completions and optimize your website accordingly.
Event tracking allows website owners to go beyond basic pageview metrics and gain a deeper understanding of user behavior and engagement. By analyzing event data, you can make data-driven decisions to improve user experience, optimize conversions, and enhance the overall performance of your website.

Learn Google
https://skillshop.withgoogle.com/
https://analytics.google.com/analytics/academy/course/5
GA4 - Google Analytics 4 PageRank Google Trends Google Keyword Planner
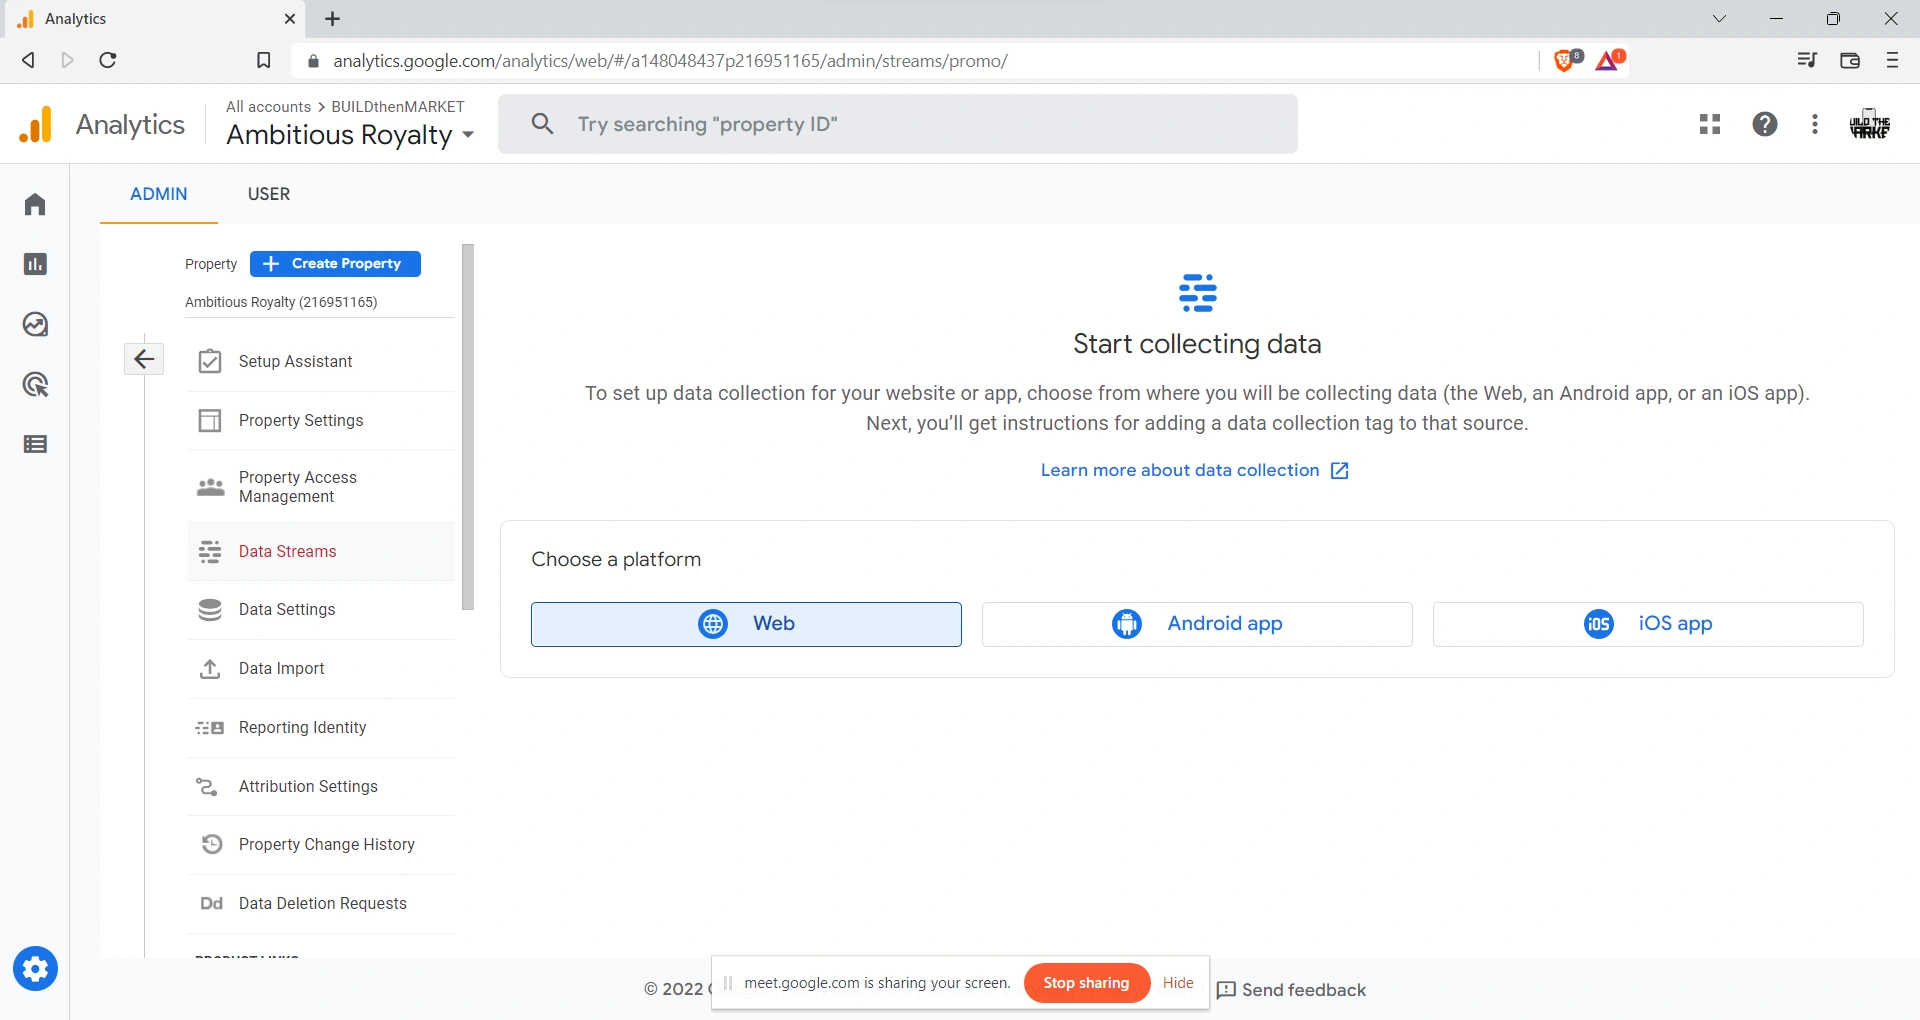
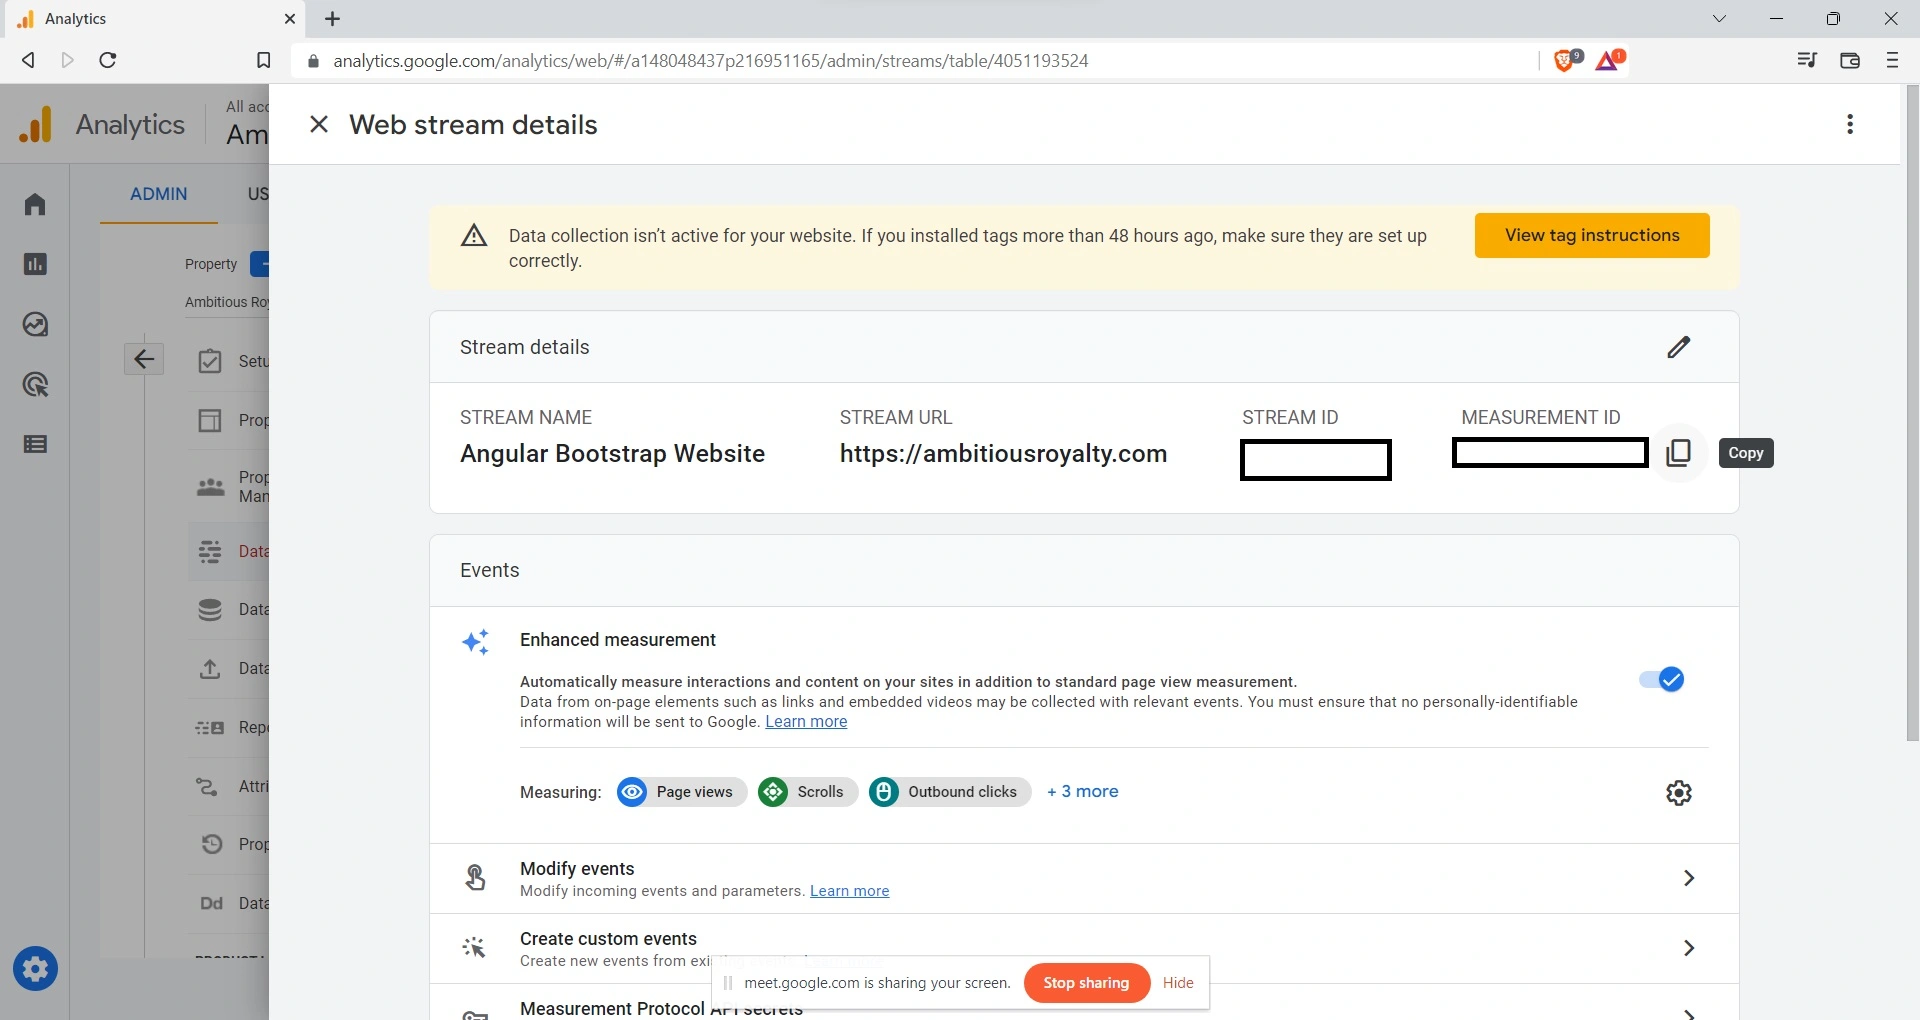
Install
Add Google Analytics

UTM Parameters
?utm_source=bing&utm_medium=cpc&src=BING&cid=281412375&utm_campaign=US%20%7C%20Stickers%20Broad%20(Alpha)&utm_term=stickers&utm_content=Stickers
?utm_source=activecampaign&utm_medium=email&utm_campaign=feb23invite&utm_content&utm_term=thryvlogo
?attr1=19215&attr3=15363&attr4=2384&attr5=2387&attr6=140229&attr10=67707&attr303=15598&attr400=119070&attr635=119072&product_id=55&width=2&height=2&&iv=__iv_m_e_c_77584397616305_k_27076083751_g_2723415215_p_2_b_be_d_c_vi__&nbs=__iv_m_e_c_77584397616305_k_27076083751_g_2723415215_p_2_b_be_d_c_vi__&utm_source=bing&utm_medium=cpc&utm_campaign=UP%7CSearch%7CStickers%7CSL&utm_term=sticker&utm_content=Stickers%7CExact%7CSK
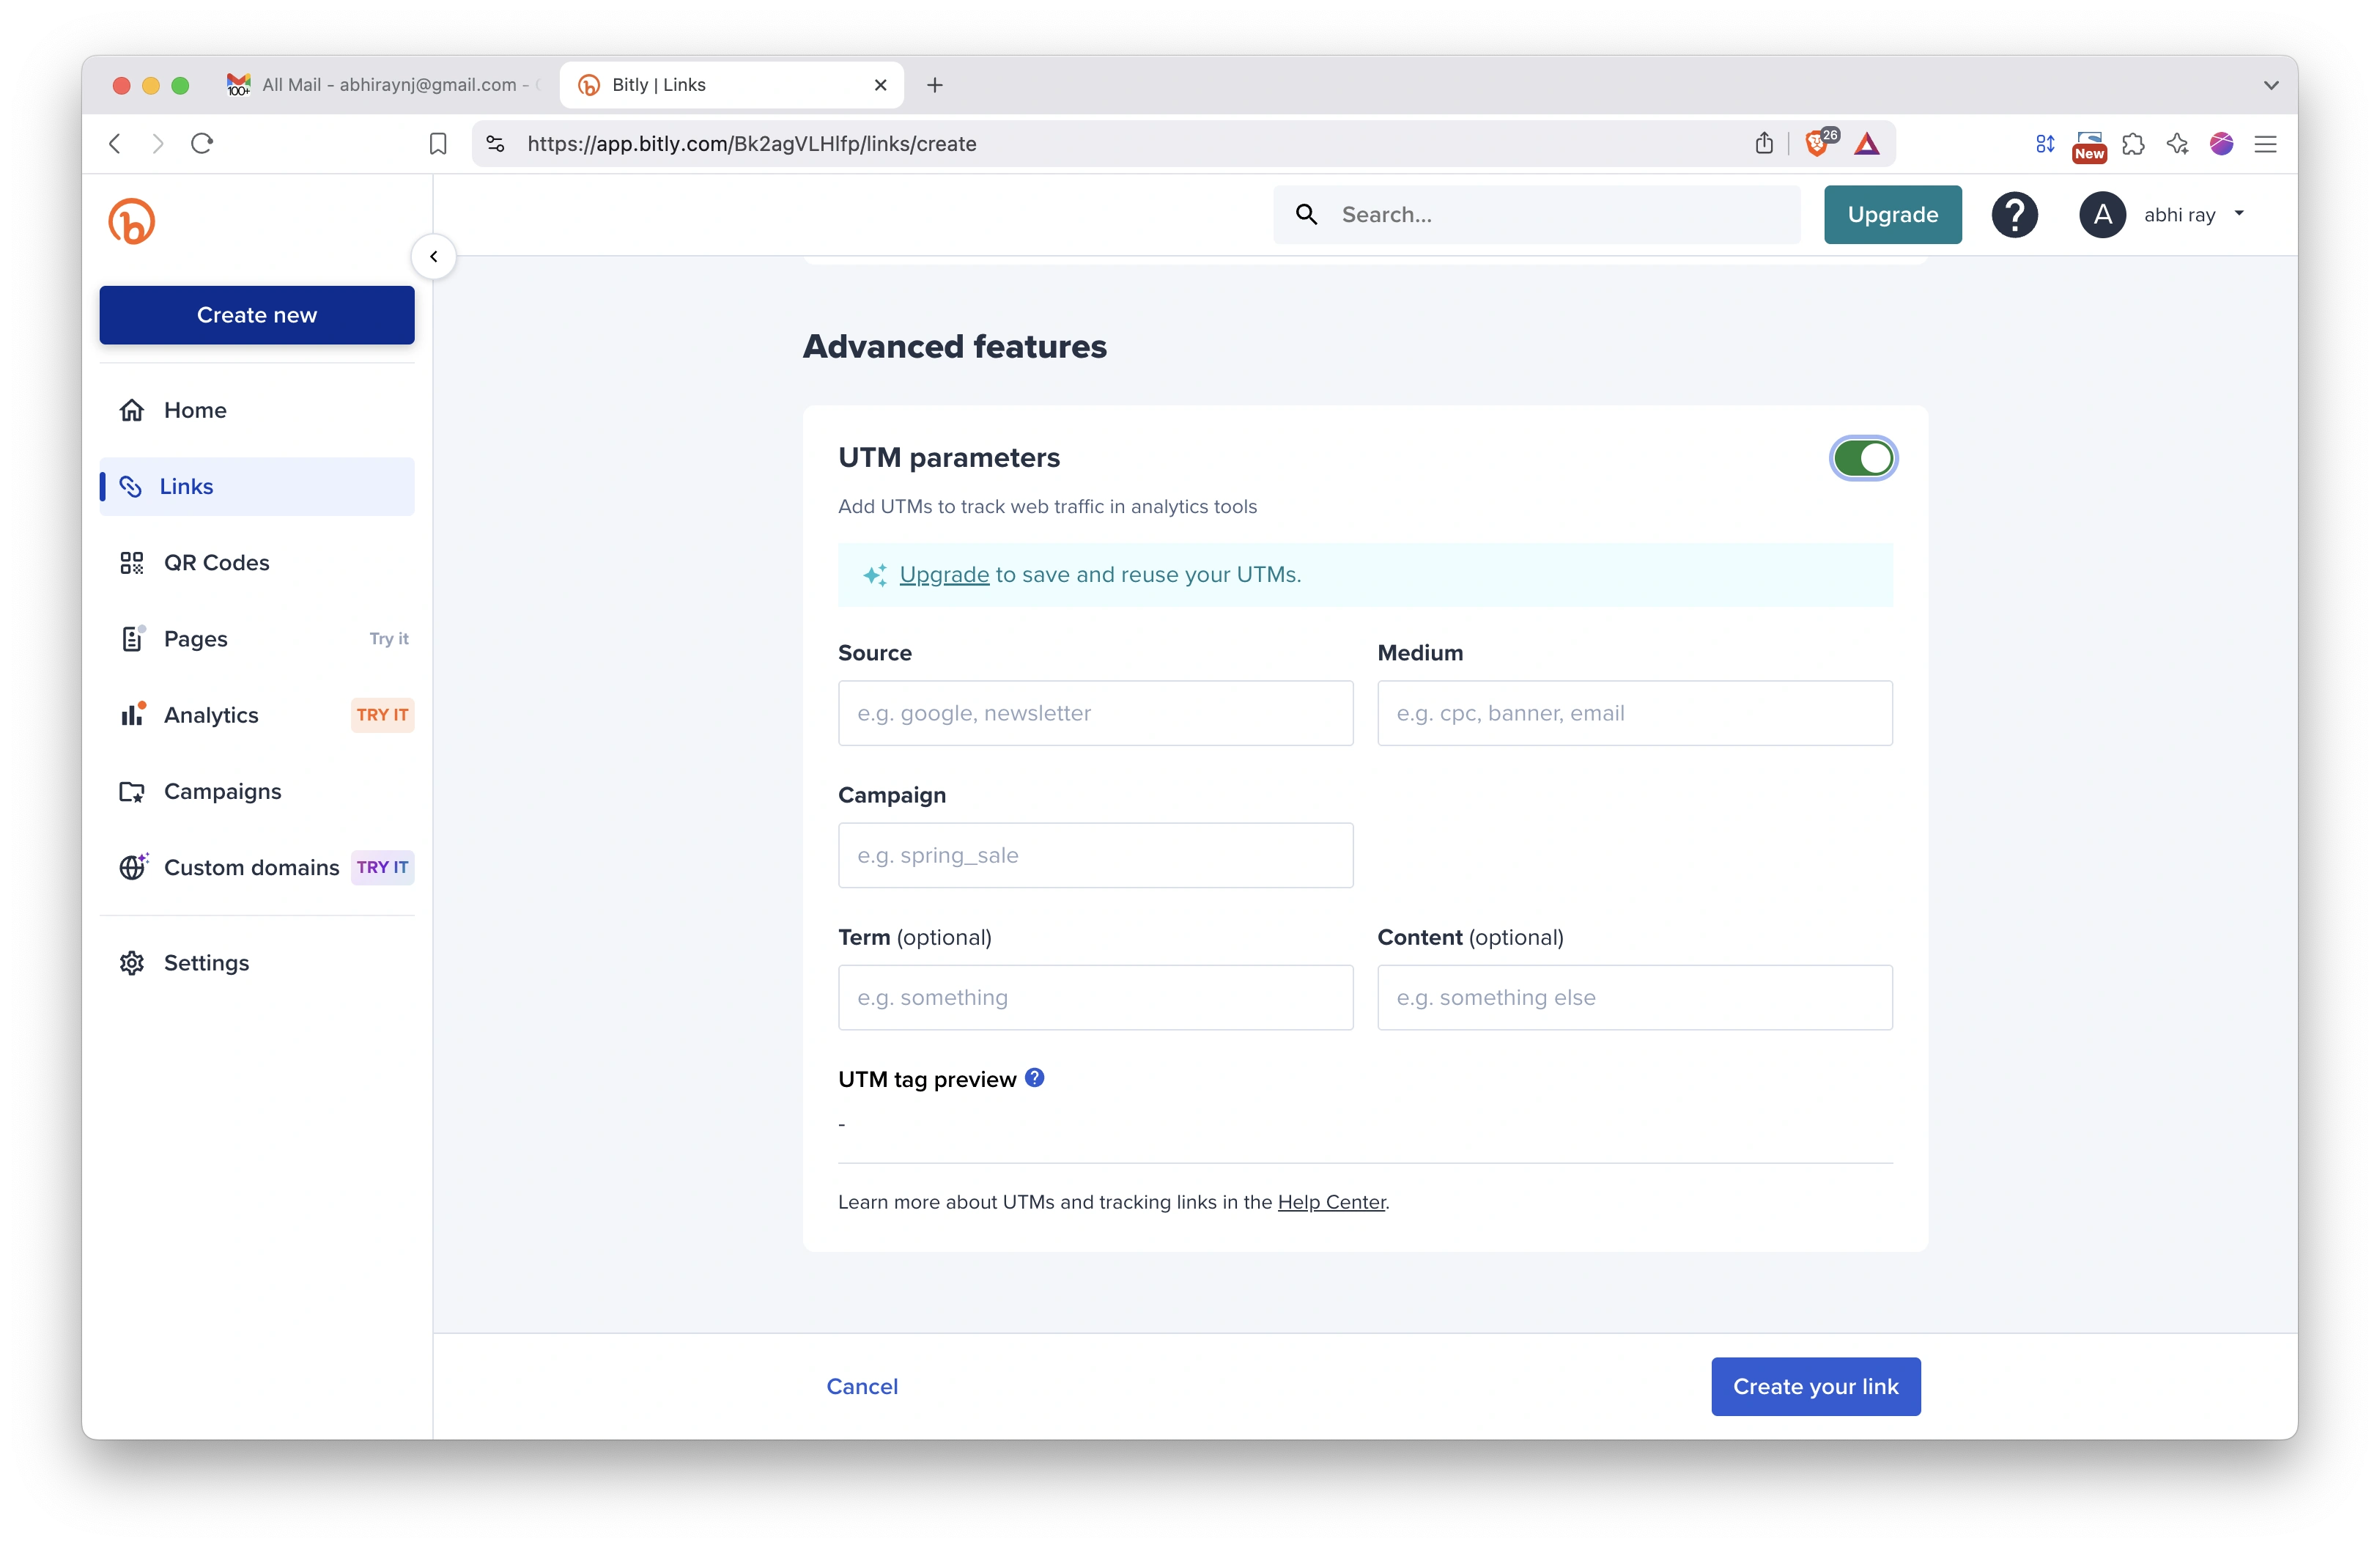
UTM parameters are a simple, straightforward, and reliable way to track traffic online. They’re not affected by changes to third-party cookies or the Facebook pixel. And they work with Google Analytics.
UTM parameters are just short pieces of code that you can add to links — for example, the links you share in your social posts. They include information about the link’s placement and purpose, making it easier to track clicks and traffic from a specific social media post or campaign.
- inbound marketing campaign parameters
- Mouse Playback
Bit.ly link shortener service UTM Params
approaches to differentiate developer test activity from organic sessions in Google Analytics to some extent
-
Exclude Developer IP Addresses: If you know the IP addresses used by developers for test activities, you can create an IP filter in Google Analytics to exclude traffic from those IP addresses. This will help filter out test sessions originating from developer machines.
-
Custom Segments: You can create custom segments in Google Analytics to filter out developer test sessions based on specific criteria. For example, you can create a segment that excludes sessions where the user agent contains certain keywords commonly associated with developer machines or test environments.
-
Event Tracking: If developers are performing specific actions during test sessions, you can use event tracking in Google Analytics to capture those actions and then exclude or filter them out from the overall session data. This requires adding custom event tracking code to your website or application.
-
Query Parameters: If developers are using specific query parameters or URLs during test sessions, you can create a filter or segment in Google Analytics to exclude sessions that contain those parameters or match those URLs.
It's important to note that these methods may not completely eliminate all developer test activity from your analytics data, as developers may use different IP addresses, user agents, or other techniques to mimic organic traffic. However, implementing these measures should help you differentiate and exclude a significant portion of developer test activity from your organic sessions in Google Analytics.