PI Planning
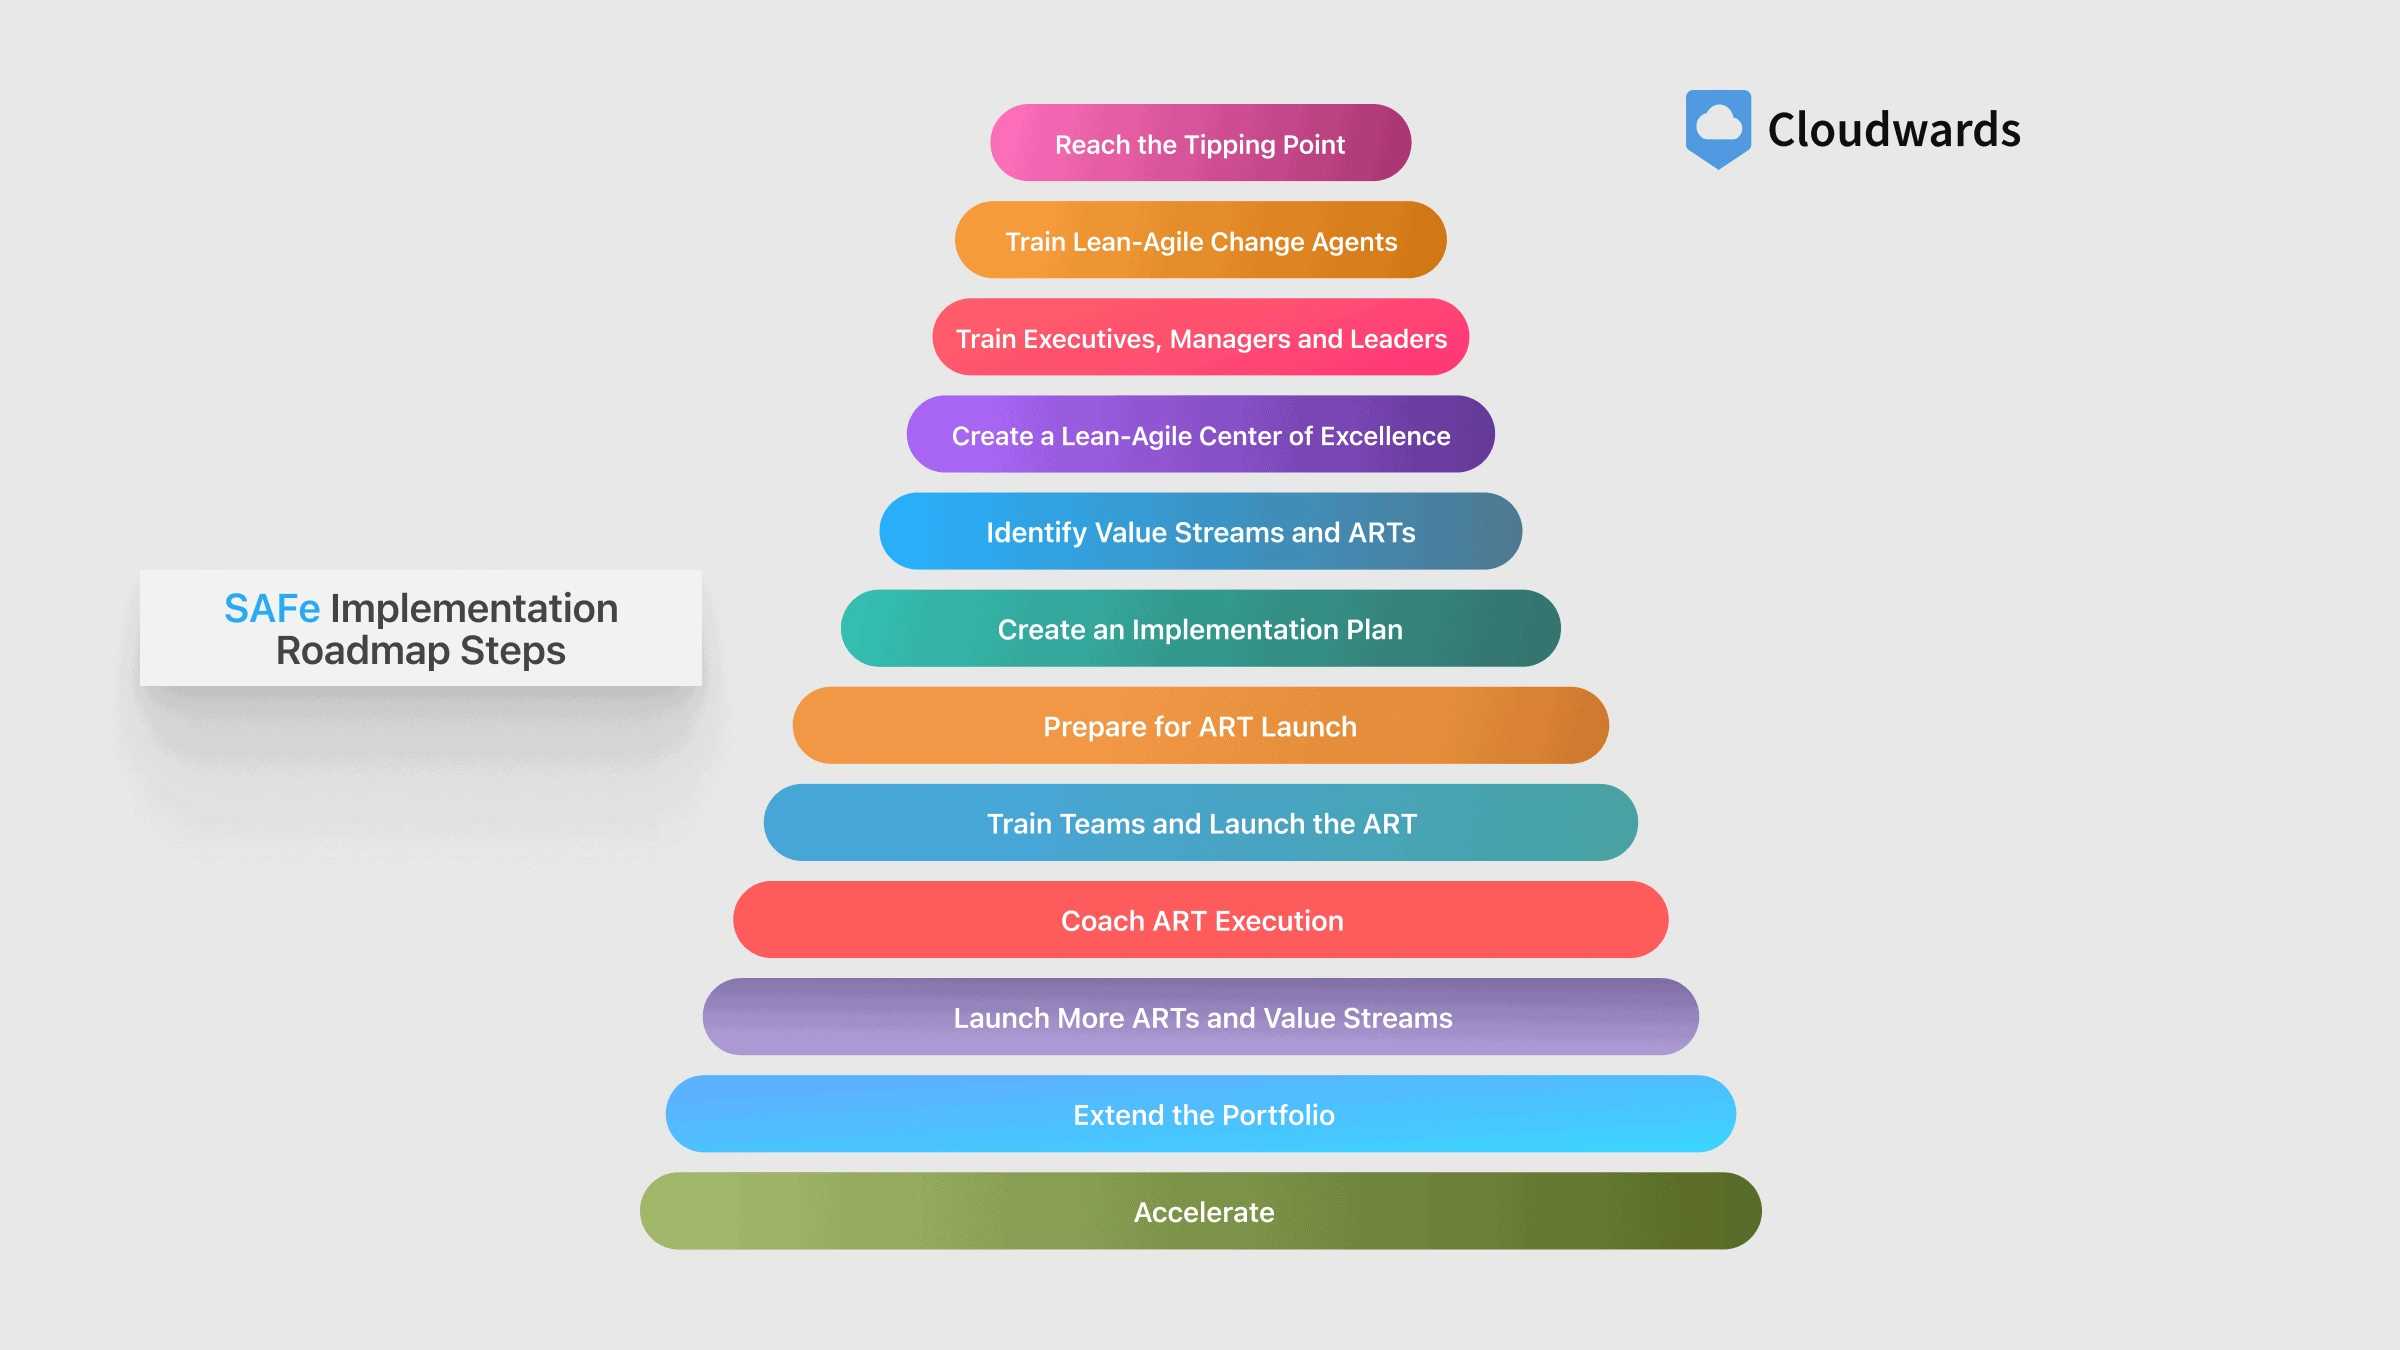
the more time a project can spend in the Planning stage of the software development cycle will guarantee time and money saved while building the app
expected deliverables
- define features for MVP and future milestones
- create, test, and optimize the app's user path
- create a page by page UX prototype enabling developers to provide accurate cost and time quotes
- consider hooks for app retention and user engagement
- determine the right platform for development
- define tracking and analytics tools
Estimating Budget & Milestones
Estimating sales for tech startups building web and mobile apps with branding, marketing, and content creation is challenging due to high complexity and uncertainty. To create effective milestones, focus on breaking down the project into manageable phases, aligning milestones with key deliverables, and incorporating flexibility to adapt to changes. Below is a structured approach to setting milestones:
1. Understand Project Scope and Variables
- Identify key components: Break the project into core areas—web app development, mobile app development, branding (logo, visual identity), marketing (strategy, campaigns), and content creation (website copy, blogs, social media).
- Acknowledge uncertainty: Recognize areas with high variability, such as user adoption rates, market response to branding, or technical challenges in app development.
- Gather data: Use historical data from similar projects, industry benchmarks (e.g., average cost per user acquisition in your niche), or customer feedback to inform estimates.
2. Adopt a Phased Approach
Organize the project into phases, each with clear objectives and measurable outcomes. This reduces uncertainty by allowing iterative refinement. Common phases include:
-
Phase 1: Discovery and Planning (1–2 months)
- Objective: Define project scope, target audience, and technical requirements.
- Milestones:
- Complete market research and competitive analysis.
- Finalize project roadmap and tech stack.
- Develop initial branding concepts (e.g., mood boards, color schemes).
- Create a marketing strategy outline.
- Deliverables: Requirements document, branding brief, marketing plan draft.
- Sales estimation focus: Estimate costs for research tools, initial design, and planning hours.
-
Phase 2: Design and Prototyping (2–3 months)
- Objective: Create wireframes, UI/UX designs, and prototypes for web/mobile apps.
- Milestones:
- Approve wireframes and user flows.
- Finalize branding assets (logo, typography, visual guidelines).
- Develop clickable prototypes for web and mobile apps.
- Produce initial content (e.g., website homepage copy, social media posts).
- Deliverables: Design mockups, prototypes, branding guidelines, content samples.
- Sales estimation focus: Estimate design hours, prototyping tools, and content creation costs. Include buffer for revisions.
-
Phase 3: Development and Content Creation (3–6 months)
- Objective: Build functional web and mobile apps and scale content/marketing efforts.
- Milestones:
- Complete backend setup (e.g., APIs, database).
- Deliver front-end for web app (e.g., MVP features).
- Release mobile app beta (iOS/Android).
- Launch initial marketing campaign (e.g., social media ads, email drip).
- Publish core content (e.g., website fully populated, 5–10 blog posts).
- Deliverables: Working MVP, marketing campaign results, content library.
- Sales estimation focus: Estimate development hours, server costs, marketing ad spend, and content production. Use agile sprints (2–4 weeks) to refine estimates.
-
Phase 4: Testing and Launch (1–2 months)
- Objective: Ensure quality, gather feedback, and launch publicly.
- Milestones:
- Complete user testing and bug fixes for web/mobile apps.
- Optimize marketing campaigns based on beta feedback.
- Finalize all content for launch (e.g., app store descriptions, press kit).
- Launch web and mobile apps publicly.
- Deliverables: Fully tested apps, optimized campaigns, launch content.
- Sales estimation focus: Estimate testing hours, launch event costs, and initial user acquisition costs.
-
Phase 5: Post-Launch and Iteration (Ongoing)
- Objective: Monitor performance, scale marketing, and iterate based on data.
- Milestones:
- Achieve target user acquisition (e.g., 1,000 active users in 3 months).
- Analyze marketing ROI and adjust campaigns.
- Release app updates based on user feedback.
- Expand content strategy (e.g., video content, webinars).
- Deliverables: Performance reports, updated apps, new content.
- Sales estimation focus: Estimate ongoing maintenance, marketing budget, and content scaling costs. Use real user data to refine revenue projections.
3. Set Flexible Milestones with Contingencies
- Use time buffers: Add 20–30% time and cost buffers to each phase to account for unforeseen delays (e.g., scope creep, technical issues, or market shifts).
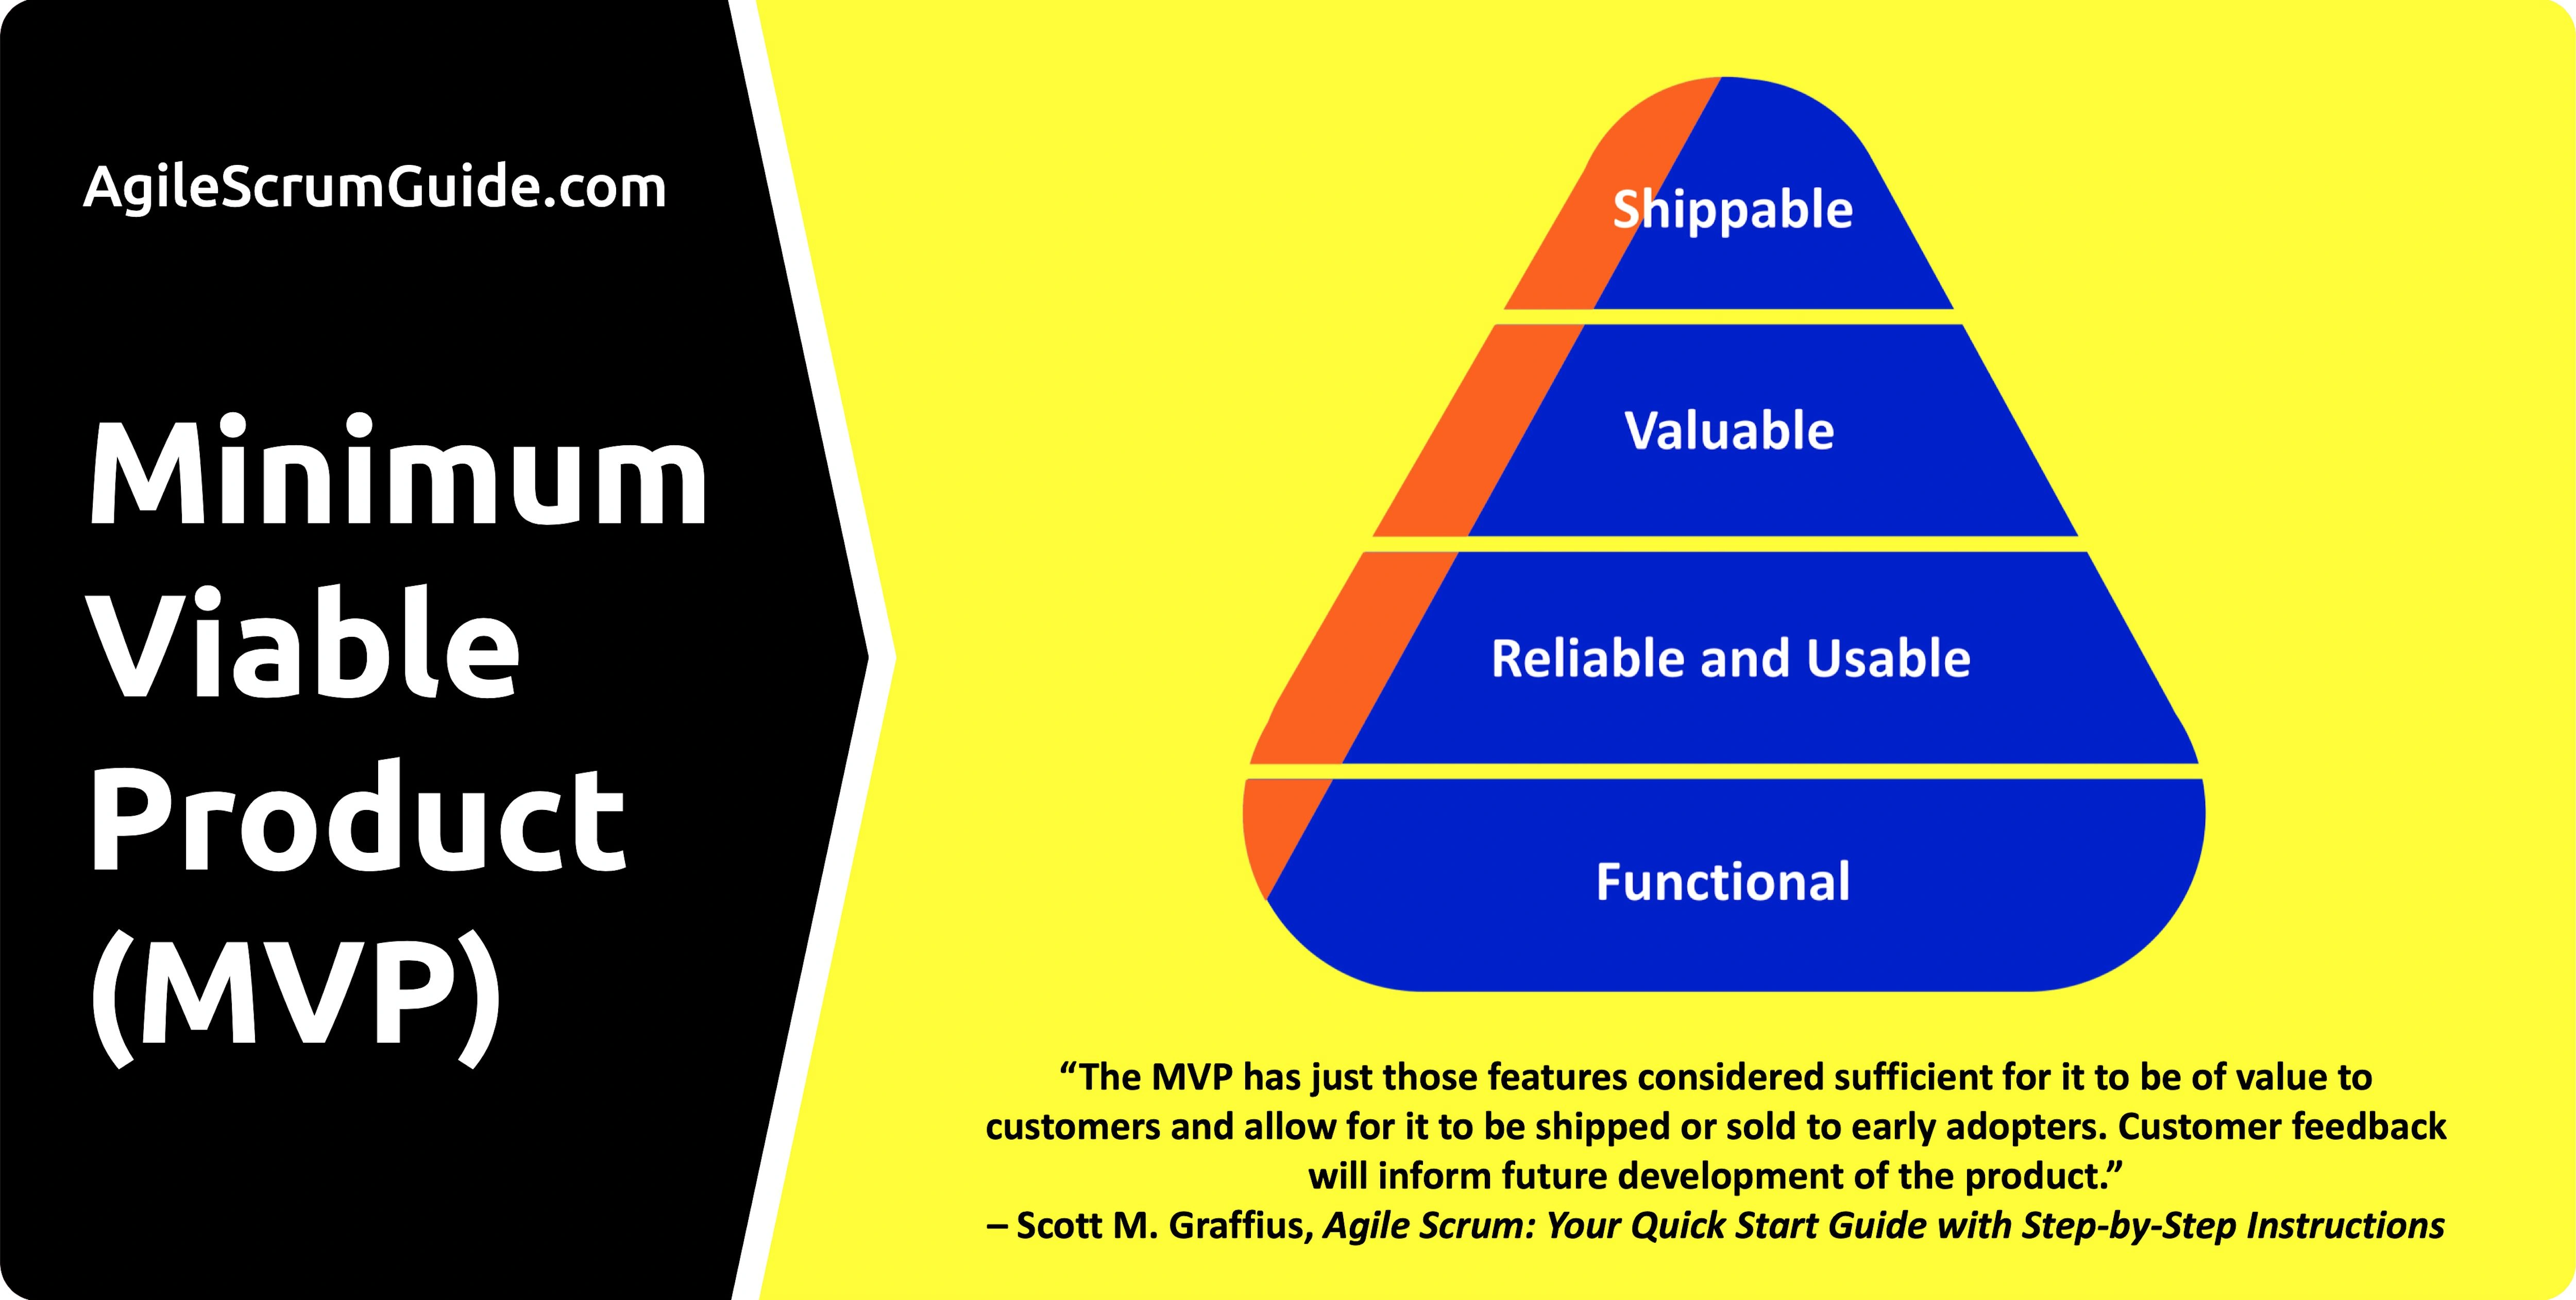
- Prioritize MVPs: Focus on minimum viable products for apps, branding, and marketing to test assumptions early and reduce risk.
- Define measurable outcomes: Ensure milestones are tied to specific, quantifiable goals (e.g., “Complete 80% of web app features” or “Acquire 500 beta users”).
- Iterate based on feedback: Use agile methodologies (e.g., Scrum) to review progress every 2–4 weeks, adjusting milestones as needed.
4. Sales Estimation Techniques
- Bottom-up estimation: Calculate costs for each task (e.g., developer hours, ad spend, content writer fees) and aggregate them for each milestone. For example:
- Web app development: 500 hours at $100/hour = $50,000.
- Branding: 100 hours at $80/hour = $8,000.
- Marketing (initial campaign): $5,000 ad spend + $2,000 strategy = $7,000.
- Top-down estimation: Use industry benchmarks (e.g., $50–$150K for a web app MVP, $10–$50K for branding) to set rough budgets, then refine with bottom-up details.
- Scenario analysis: Create best-case, worst-case, and most-likely sales forecasts based on user acquisition, conversion rates, and revenue per user. For example:
- Best-case: 10,000 users at $5/month = $50,000/month.
- Worst-case: 1,000 users at $5/month = $5,000/month.
- Track assumptions: Document assumptions (e.g., “10% conversion rate from ads”) and validate them during early milestones to improve accuracy.
5. Tools and Frameworks
- Project management: Use tools like Jira, Trello, or Asana to track milestones and tasks.
- Budgeting: Use spreadsheets (e.g., Google Sheets, Excel) or tools like QuickBooks for cost tracking.
- Analytics: Use Google Analytics, Mixpanel, or Hotjar to measure user engagement and marketing performance post-launch.
- Communication: Use Slack or Microsoft Teams to align stakeholders on milestone progress.
6. Mitigate Risks
- Engage stakeholders early: Involve clients, developers, and marketers in planning to align expectations.
- Validate with prototypes: Test branding and app prototypes with target users to reduce rework.
- Monitor market trends: Stay updated on competitors and industry shifts (e.g., new app store guidelines) to adjust milestones.
- Regular reviews: Conduct biweekly or monthly reviews to assess milestone progress and recalibrate estimates.
Example Milestone Timeline (12-Month Project)
| Phase | Duration | Key Milestones | Estimated Cost |
|---|---|---|---|
| Discovery & Planning | 2 months | Market research, roadmap, branding brief | $10–20K |
| Design & Prototyping | 3 months | Wireframes, prototypes, branding assets | $20–40K |
| Development & Content | 5 months | MVP apps, marketing campaigns, content | $50–100K |
| Testing & Launch | 2 months | User testing, public launch | $15–30K |
| Post-Launch | Ongoing | User acquisition, updates, content scaling | $10–20K/month |
Key Tips
- Start small: Launch with an MVP to test market fit before scaling.
- Be transparent: Share uncertainties with stakeholders and agree on flexible milestones.
- Leverage data: Use early-phase data (e.g., prototype feedback, ad performance) to refine later estimates.
- Focus on value: Prioritize milestones that drive user engagement or revenue (e.g., app core features, high-ROI marketing).
Estimating complexity and hours
Estimating complexity and hours for a tech startup’s web and mobile app projects, including branding, marketing, and content creation, requires a systematic approach to account for high uncertainty and variability. Below is an in-depth guide to estimating complexity and hours, tailored to these multifaceted projects. The goal is to break down tasks, assess their complexity, and derive realistic hour estimates while managing risks.
1. Break Down the Project into Workstreams and Tasks
To estimate complexity and hours accurately, decompose the project into granular tasks across all workstreams: web app development, mobile app development, branding, marketing, and content creation. Use a Work Breakdown Structure (WBS) to organize tasks hierarchically.
Steps
- Identify workstreams:
- Web App Development: Frontend, backend, database, APIs, testing.
- Mobile App Development: iOS/Android native or cross-platform, UI/UX, testing.
- Branding: Logo design, visual identity, style guide.
- Marketing: Strategy, campaigns (social media, SEO, ads), analytics.
- Content Creation: Website copy, blog posts, social media content, app store descriptions.
- List tasks per workstream: For each workstream, break down tasks to the smallest actionable level. For example:
- Web App Development:
- Set up hosting and domain.
- Design database schema.
- Develop user authentication API.
- Build homepage UI.
- Conduct unit testing.
- Branding:
- Research competitor branding.
- Create three logo concepts.
- Develop typography and color palette.
- Web App Development:
- Use templates or tools: Leverage project management tools like Jira, Trello, or Notion to document tasks. Alternatively, use spreadsheets to list tasks with columns for description, workstream, and dependencies.
Example WBS (Partial)
| Workstream | Task | Subtask |
|---|---|---|
| Web App Development | Backend Setup | Configure server |
| Design database schema | ||
| Frontend Development | Build homepage UI | |
| Branding | Logo Design | Research competitor logos |
| Create initial logo concepts | ||
| Marketing | Social Media Campaign | Define target audience |
| Create ad creatives |
2. Assess Task Complexity
Complexity drives effort and hours. Evaluate each task’s complexity based on technical difficulty, dependencies, uncertainty, and required expertise. Use a structured framework to standardize assessments.
Complexity Factors
- Technical Difficulty: Does the task require advanced skills (e.g., integrating a complex API vs. setting up a static webpage)?
- Dependencies: Does the task rely on other tasks or external inputs (e.g., backend APIs must be ready before frontend integration)?
- Uncertainty: Are requirements clear, or is there ambiguity (e.g., branding concepts may need multiple iterations)?
- Experience Level Required: Does the task need a senior developer, designer, or junior contributor?
- Scale: Does the task involve repetitive work (e.g., creating 50 social media posts vs. one)?
Complexity Scoring
Assign a complexity score (e.g., Low, Medium, High or 1–5) to each task based on the factors above. Alternatively, use a weighted scoring system:
- Technical Difficulty (40%): 1–5
- Dependencies (20%): 1–5
- Uncertainty (20%): 1–5
- Expertise Needed (20%): 1–5
- Scoring Example (Develop User Authentication API):
- Technical Difficulty: 4 (requires security expertise)
- Dependencies: 3 (needs database schema)
- Uncertainty: 2 (requirements are well-defined)
- Expertise Needed: 4 (senior developer)
- Weighted Score: (4 × 0.4) + (3 × 0.2) + (2 × 0.2) + (4 × 0.2) = 1.6 + 0.6 + 0.4 + 0.8 = 3.4 (Medium-High Complexity)
Qualitative Guidelines
| Complexity Level | Description | Examples |
|---|---|---|
| Low | Simple, repetitive, well-defined | Write a single blog post, set up hosting |
| Medium | Moderate skill, some dependencies | Build a landing page, create a logo |
| High | Complex, uncertain, specialized | Develop a custom API, run a multi-channel ad campaign |
3. Estimate Hours per Task
Once complexity is assessed, estimate hours using a combination of historical data, expert judgment, and estimation techniques. Account for different roles (e.g., developer, designer, marketer) and their hourly effort.
Estimation Techniques
- Expert Judgment:
- Consult team members or freelancers with experience in similar tasks.
- Example: A senior developer estimates 20 hours to build a user authentication API based on past projects.
- Analogous Estimation:
- Use data from previous projects. If a similar web app’s homepage took 40 hours, use that as a baseline.
- Adjust for differences (e.g., more features = +20% hours).
- Three-Point Estimation (PERT):
- For each task, estimate:
- Optimistic (O): Best-case scenario.
- Most Likely (M): Realistic scenario.
- Pessimistic (P): Worst-case scenario.
- Calculate: Expected Hours = (O + 4M + P) / 6
- Example (Design Homepage UI):
- O = 10 hours, M = 15 hours, P = 25 hours
- Expected Hours = (10 + 4×15 + 25) / 6 = (10 + 60 + 25) / 6 = 15.83 hours
- For each task, estimate:
- Parametric Estimation:
- Use industry benchmarks or metrics. For example:
- Web development: 10–20 hours per page for simple pages, 50–100 hours for complex features.
- Logo design: 10–30 hours for 2–3 concepts.
- Blog post (500 words): 2–5 hours for writing + editing.
- Use industry benchmarks or metrics. For example:
- Bottom-Up Estimation:
- Sum hours for subtasks to get task-level estimates.
- Example (Backend Setup):
- Configure server: 5 hours
- Design database schema: 10 hours
- Total: 15 hours
Role-Based Hour Allocation
Assign hours based on the role required for each task. Example rates:
- Developer (Web/Mobile): Frontend (10–20 hours/page), Backend (20–50 hours/feature).
- Designer: UI/UX (10–30 hours/screen), Branding (20–50 hours for full identity).
- Marketer: Strategy (10–20 hours), Campaign setup (5–15 hours/channel).
- Content Writer: Blog post (2–5 hours), Website copy (5–20 hours/page).
Example Hour Estimates
| Task | Complexity | Role | O (hours) | M (hours) | P (hours) | Expected Hours (PERT) |
|---|---|---|---|---|---|---|
| Design database schema | Medium | Backend Developer | 8 | 10 | 15 | 10.5 |
| Create logo concepts | High | Designer | 15 | 20 | 30 | 20.8 |
| Write homepage copy | Low | Content Writer | 3 | 5 | 8 | 5.2 |
| Set up social media campaign | Medium | Marketer | 10 | 15 | 25 | 15.8 |
4. Account for Non-Development Hours
Beyond core tasks, include hours for project management, communication, testing, and revisions, which often account for 20–30% of total effort.
- Project Management: 10–15% of total hours (e.g., planning, standups, tracking).
- Example: For a 500-hour project, allocate 50–75 hours.
- Meetings and Communication: 5–10% of total hours (e.g., client reviews, team syncs).
- Example: 25–50 hours for a 500-hour project.
- Testing and QA:
- Unit testing: 10–20% of development hours.
- User acceptance testing: 5–10 hours per major feature.
- Revisions and Feedback:
- Branding: 2–3 revision cycles (5–10 hours per cycle).
- Content: 1–2 revisions per piece (1–3 hours each).
- App features: 10–20% of development hours for bug fixes.
Example
For a web app MVP (500 development hours):
- Development: 500 hours
- Project Management: 75 hours (15%)
- Communication: 50 hours (10%)
- Testing: 100 hours (20%)
- Revisions: 50 hours (10%)
- Total: 775 hours
5. Incorporate Buffers for Uncertainty
High complexity and uncertainty require buffers to avoid underestimation. Add time and cost buffers based on project risk.
Buffer Strategies
- Time Buffer: Add 20–30% to total hours for unexpected delays (e.g., scope creep, technical issues).
- Example: 775 hours + 25% = 968.75 hours.
- Contingency by Complexity:
- Low complexity: +10% hours.
- Medium complexity: +20% hours.
- High complexity: +30–50% hours.
- Iterative Refinement: Use agile sprints (2–4 weeks) to reassess estimates based on actual progress.
Example with Buffers
| Task | Base Hours | Complexity | Buffer | Total Hours |
|---|---|---|---|---|
| Design database schema | 10.5 | Medium | +20% (2.1) | 12.6 |
| Create logo concepts | 20.8 | High | +30% (6.2) | 27.0 |
| Write homepage copy | 5.2 | Low | +10% (0.5) | 5.7 |
6. Validate Estimates
Cross-check estimates to improve accuracy and reduce bias.
- Team Review: Have developers, designers, and marketers review their respective tasks.
- Historical Data: Compare estimates to past projects. If a similar API took 25 hours, adjust if current requirements differ.
- External Benchmarks: Use industry standards:
- Web app MVP: 500–1,000 hours.
- Mobile app MVP: 600–1,200 hours.
- Branding package: 50–150 hours.
- Marketing campaign: 50–200 hours.
- Client Feedback: Share estimates with stakeholders to align expectations.
7. Tools and Templates
-
Estimation Tools:
- Trello/Jira: Track tasks and hours.
- Harvest/Forecast: Log time and forecast budgets.
- Excel/Google Sheets: Create custom estimation templates.
-
Template Example (Google Sheets):
Task Workstream Complexity Role O (hours) M (hours) P (hours) Expected Hours Buffer Total Hours Design database Web App Medium Developer 8 10 15 10.5 2.1 12.6 -
Time Tracking: Use Toggl or Clockify to monitor actual hours vs. estimates during execution.
8. Example: End-to-End Estimation
For a web app MVP with branding and marketing (6-month timeline):
Workstream Breakdown
- Web App Development (400 hours):
- Backend (150 hours): APIs, database, authentication.
- Frontend (200 hours): 5 pages, user dashboard.
- Testing (50 hours): Unit, integration.
- Branding (100 hours):
- Logo and visual identity (50 hours).
- Style guide (30 hours).
- Revisions (20 hours).
- Marketing (150 hours):
- Strategy (30 hours).
- Social media campaign (80 hours).
- Analytics setup (40 hours).
- Content Creation (80 hours):
- Website copy (40 hours).
- 5 blog posts (25 hours).
- App store descriptions (15 hours).
- Overhead (120 hours):
- Project management (70 hours).
- Communication (30 hours).
- Contingency (20 hours).
Total Hours
- Base: 400 + 100 + 150 + 80 + 120 = 850 hours
- Buffer (+25%): 850 × 1.25 = 1,062.5 hours
Cost Estimate (Assuming $100/hour average rate)
- Total Cost: 1,062.5 × $100 = $106,250
9. Mitigate Risks and Refine Estimates
- Start with MVP: Focus on core features to reduce initial complexity.
- Iterate Frequently: Reassess estimates every sprint (2–4 weeks) using actual data.
- Document Assumptions: Note uncertainties (e.g., “Assumes no third-party API issues”) to revisit later.
Key Tips for Startups
- Prioritize high-impact tasks: Focus on features/users value most (e.g., core app functionality, compelling branding).
- Leverage freelancers: For specialized tasks (e.g., logo design), hire experts to save time.
- Monitor burn rate: Track hours weekly to avoid budget overruns.
- Communicate uncertainty: Share ranges (e.g., 800–1,200 hours) with stakeholders to set realistic expectations.
If you need a custom estimation template, specific benchmarks, or help with a particular workstream, let me know!
Business Days
- average of 250 business days.
- between 20 and 23 business days in a month.